SQL analytics · Case study
Toronto Crime SQL Analytics
Turning a decade of Toronto police reports into reproducible questions and a public dashboard.
At a glance
- City open data
- DuckDB + 20 SQL questions
- Generated tables + 4 charts
- Findings + dashboard
The problem
A large open dataset invites striking claims, but row counts, partial years and neighbourhood rates can mislead without careful definitions.
My role
Independent project. I framed the questions, wrote the SQL, built the DuckDB workflow and published the findings and dashboard.
Key decision
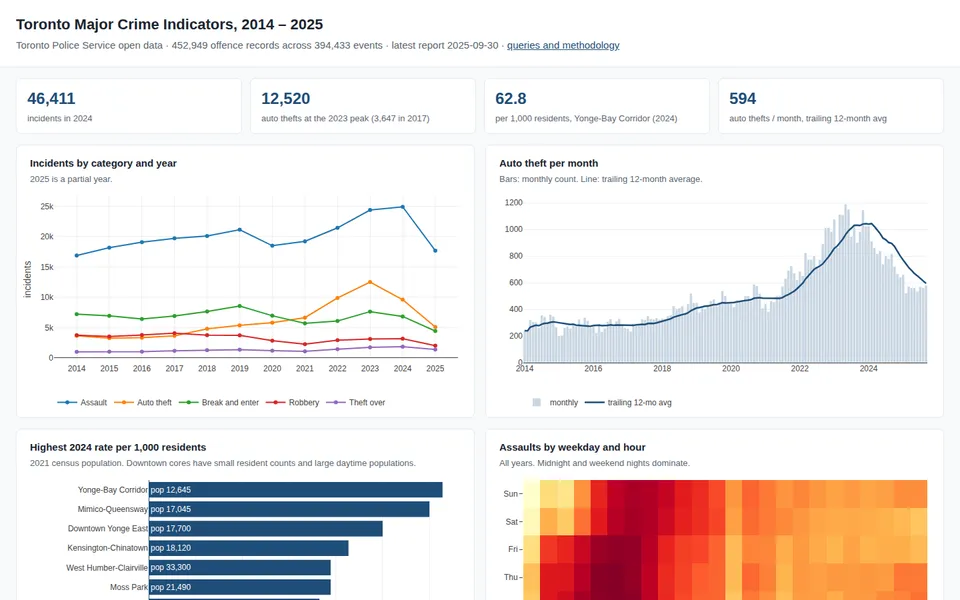
I kept one query per question and generated result tables alongside four charts. I separated incident rows from distinct police events and excluded partial 2025 data from year-over-year comparisons.
Outcome
The 22 September 2026 snapshot contains 452,949 incident rows from 2014–2025. One finding: auto theft rose 243% from 2017 to 2023, then fell 23% in 2024.
Limits
These are police-reported incidents, not a measure of all crime. A single event can produce multiple offence rows, and 2021 population denominators can overstate per-resident rates in busy downtown areas.
See the work
The repository contains the source, setup instructions and the evidence behind these results.